
Insightly
Drop in a CSV and get the story, without the file ever leaving your browser.
- Year
- 2026
- Role
- Solo developer
tryinsightly.vercel.app
The problem
Getting a quick, honest read on a messy dataset usually means uploading it to a service or writing code first.
The solution
Insightly is a privacy-first data profiling tool. You drop in a CSV and it scores data quality, charts the distributions and writes plain-English insights, all inside the browser.
- Detects the delimiter and column types, with manual override.
- Gives a 0 to 100 data quality score with a transparent breakdown.
- Per-column statistics, histograms, category bars, time series, scatter plots, a correlation heatmap and box plots.
- Writes 8 to 12 ranked plain-English insights ("Whispers"), each a pure function in its own file.
- Cleaning helpers with a before and after score, a virtualised table for 50,000+ rows, and PDF, HTML and Markdown export.
Key screens
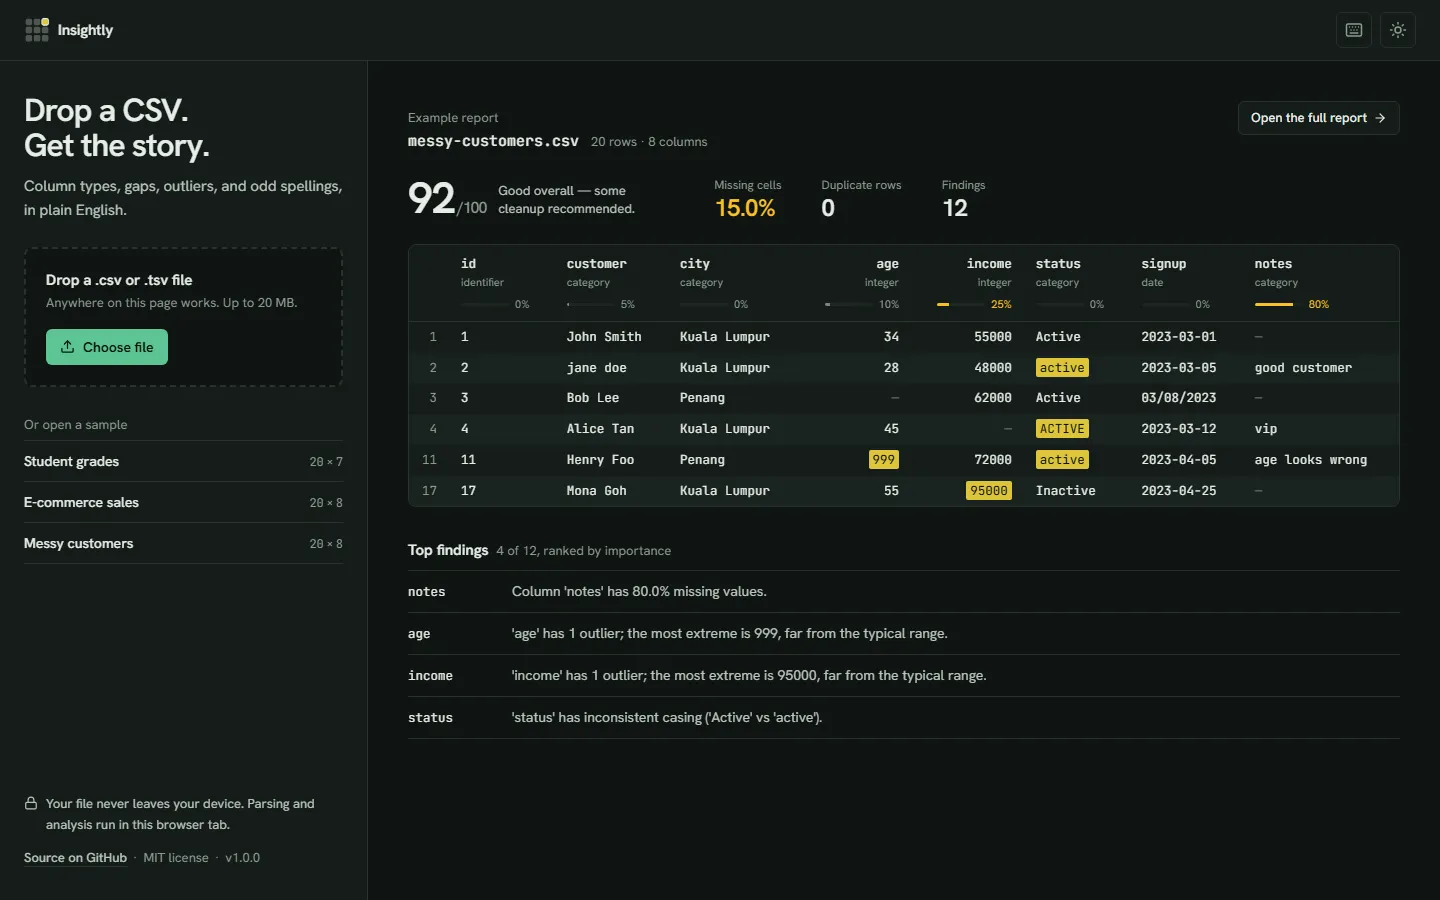
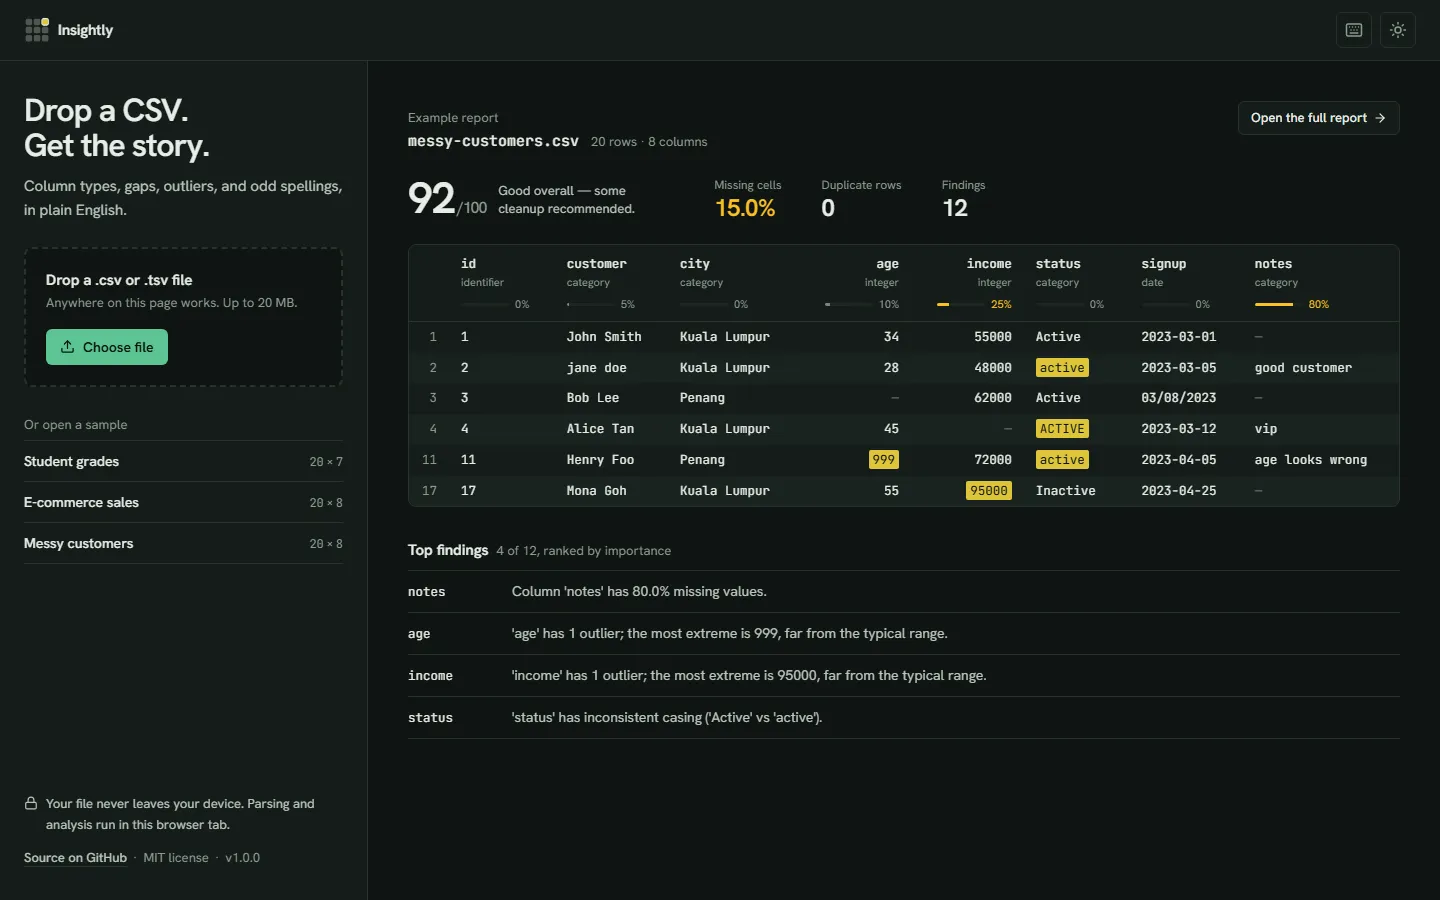
Example report: quality score, column profile and ranked findings.
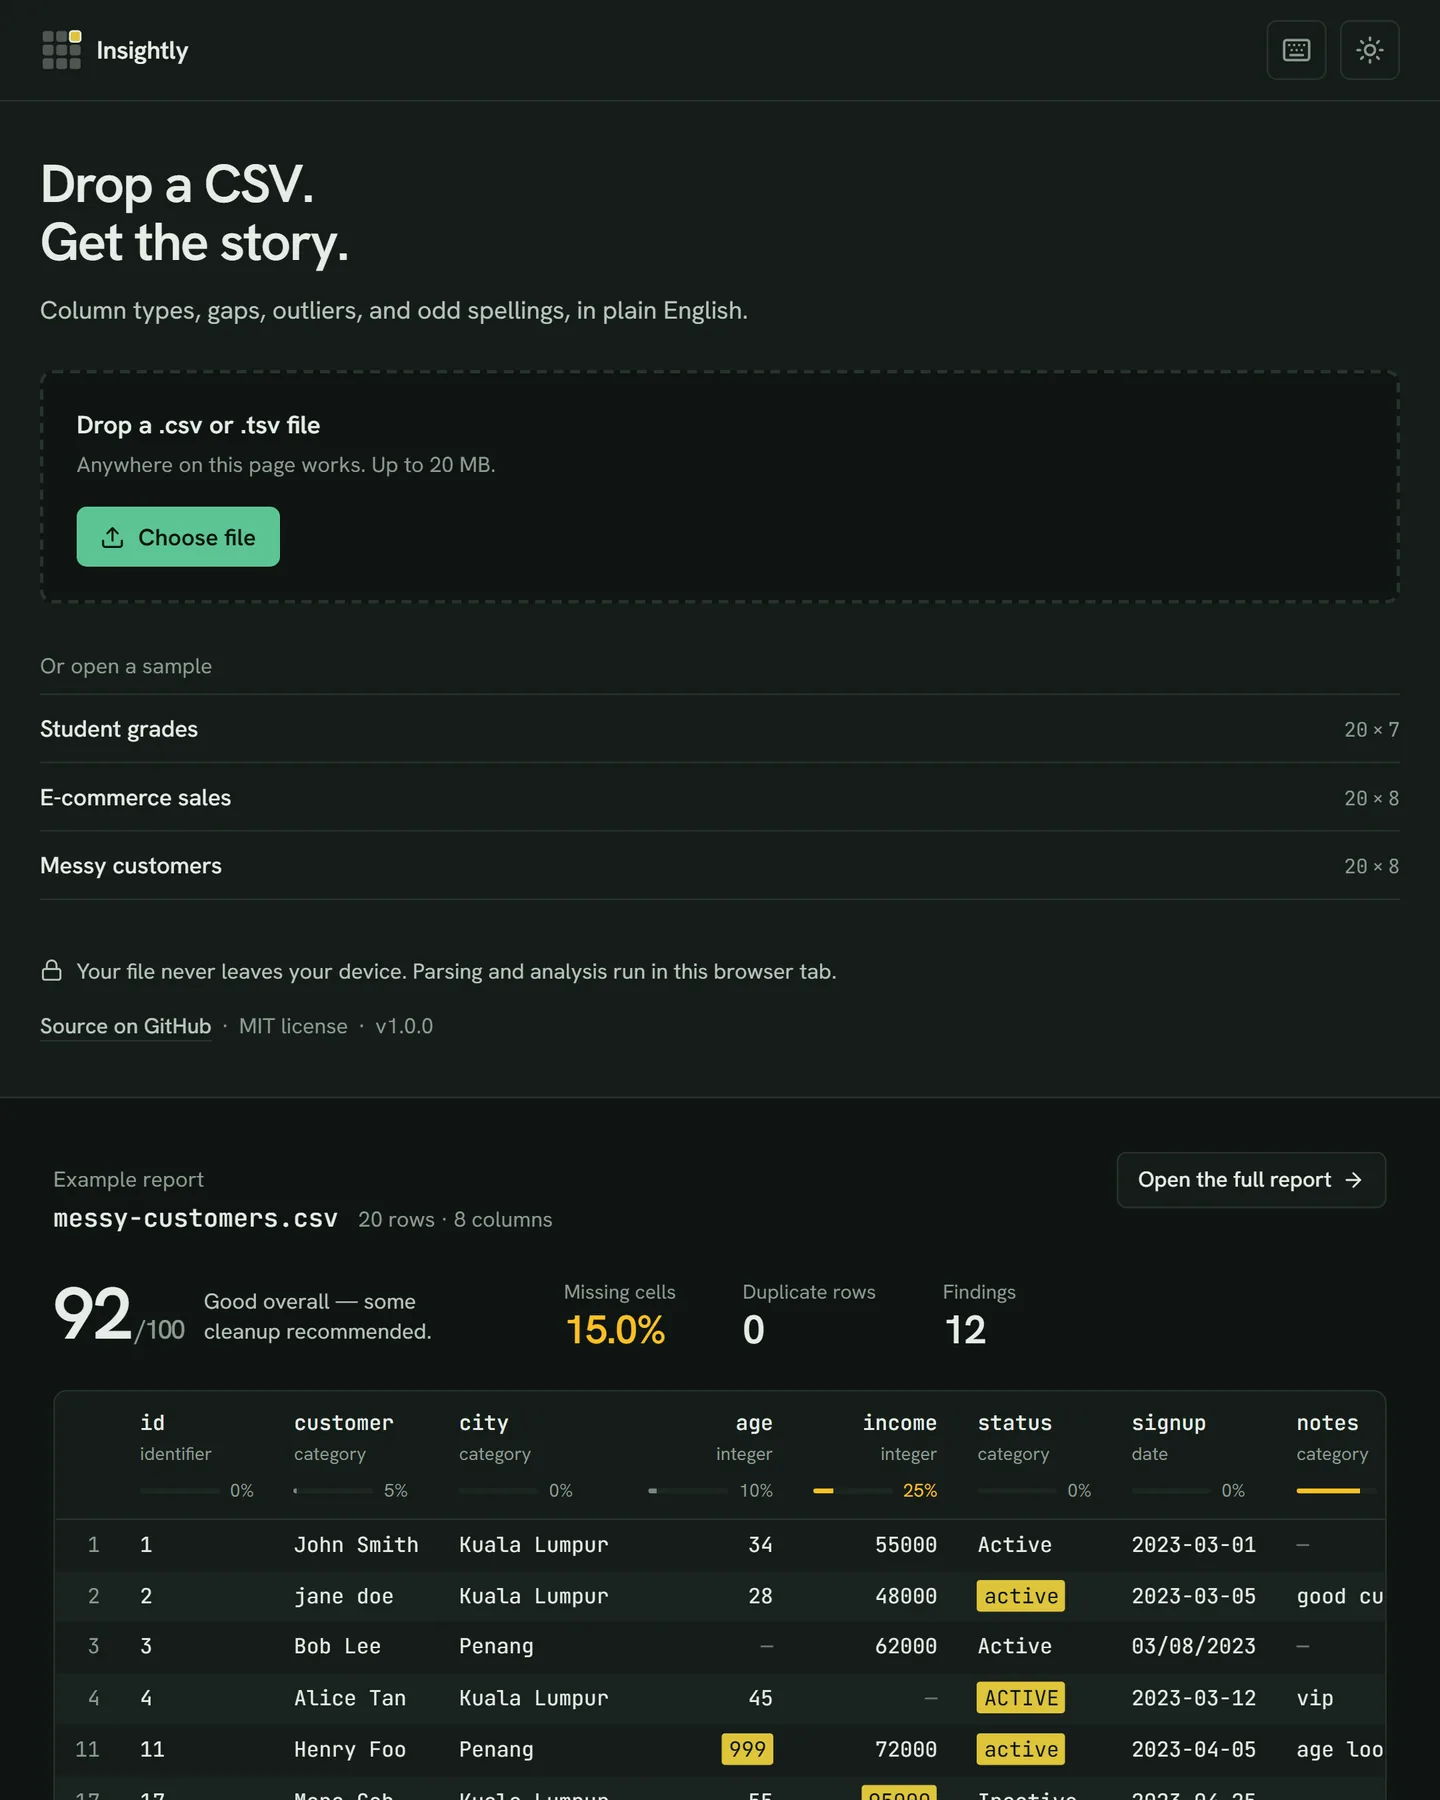
Landing page in dark mode: drop a CSV or open a sample. 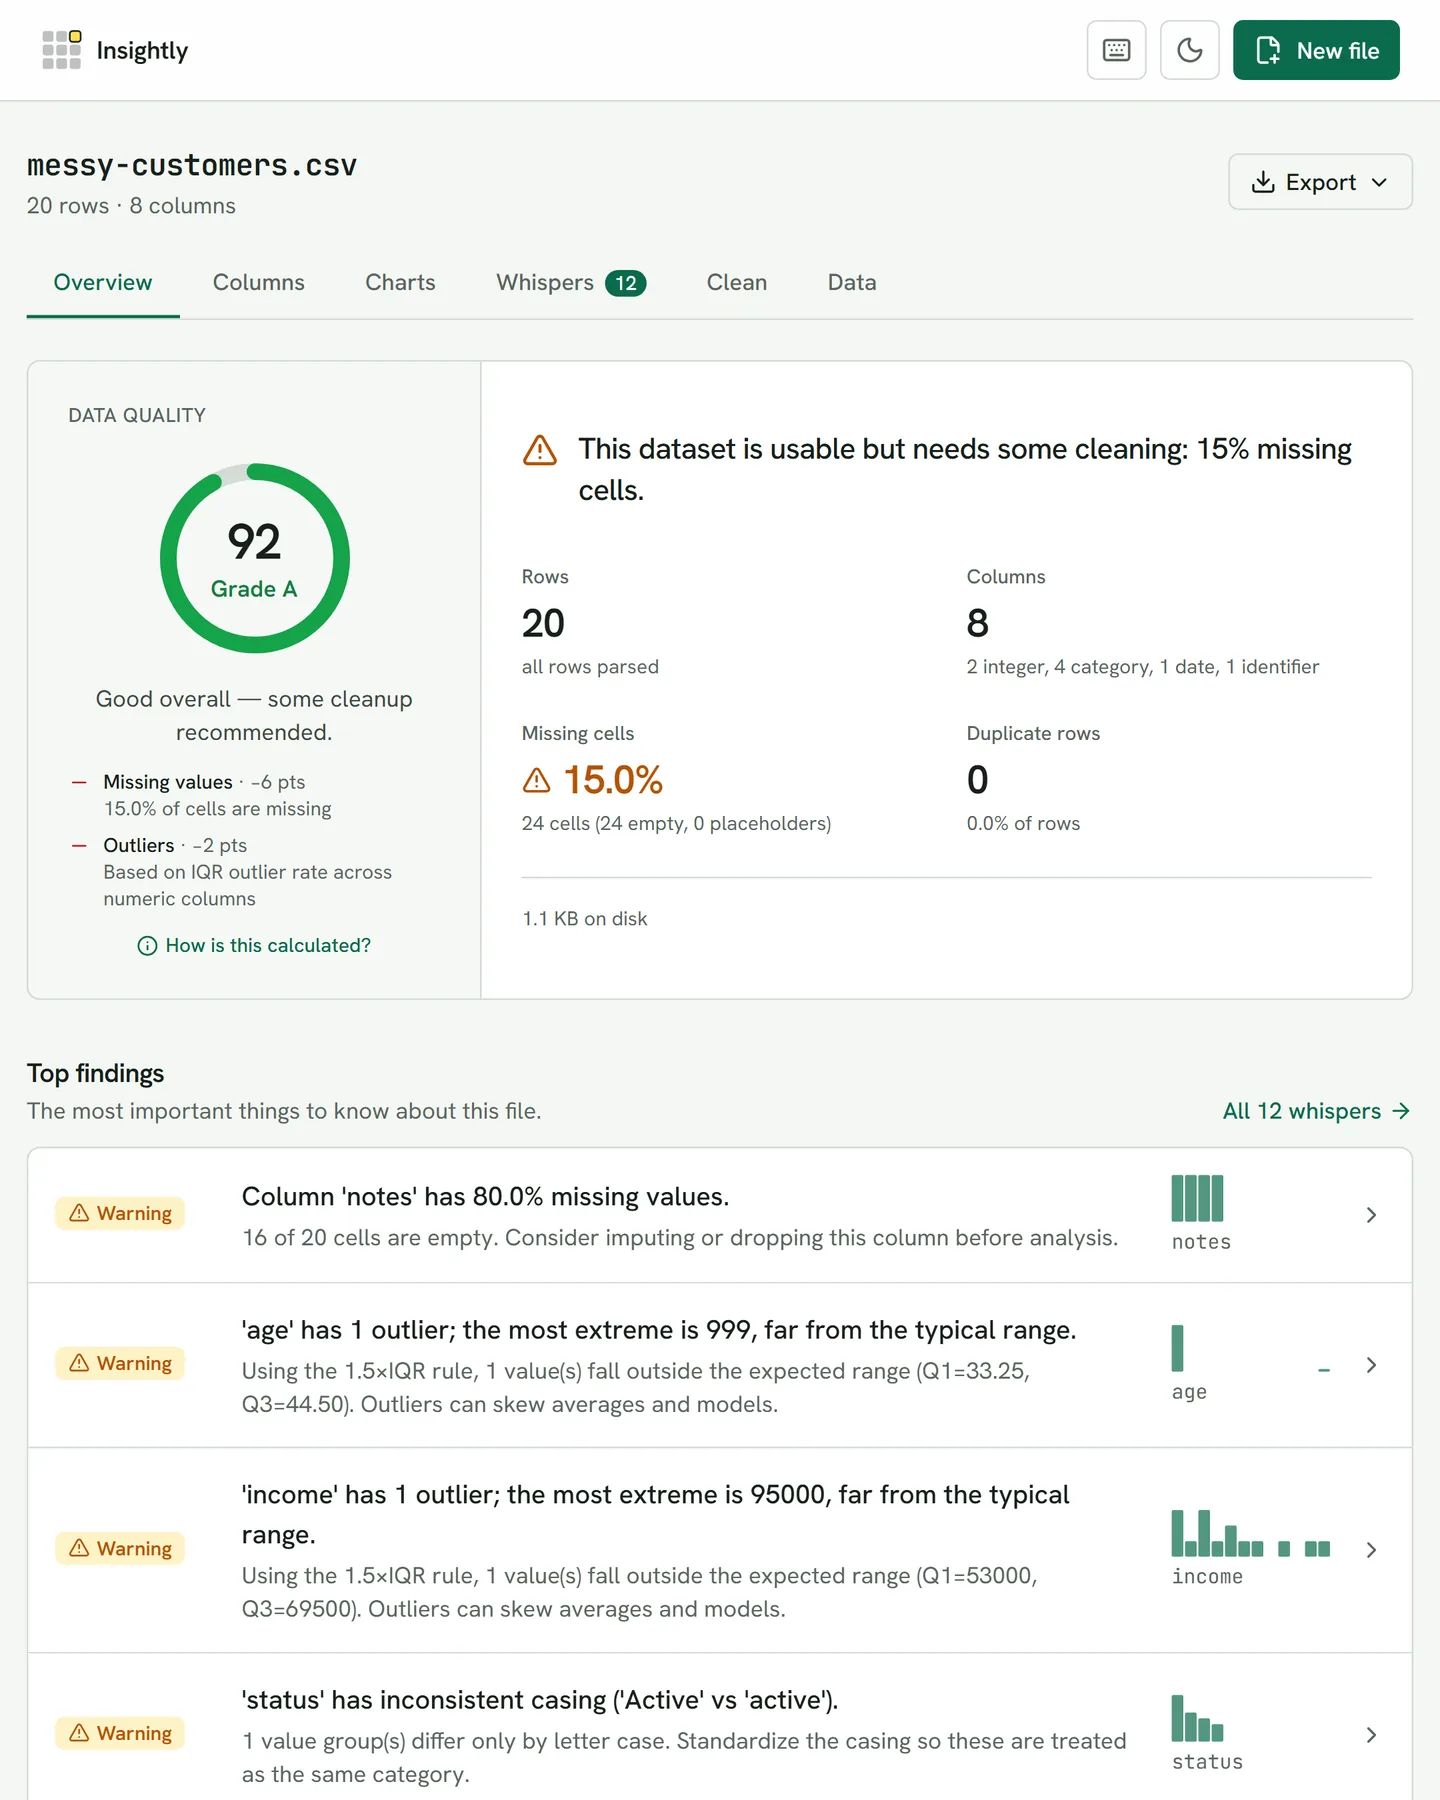
Overview: quality score with its breakdown and the top findings. 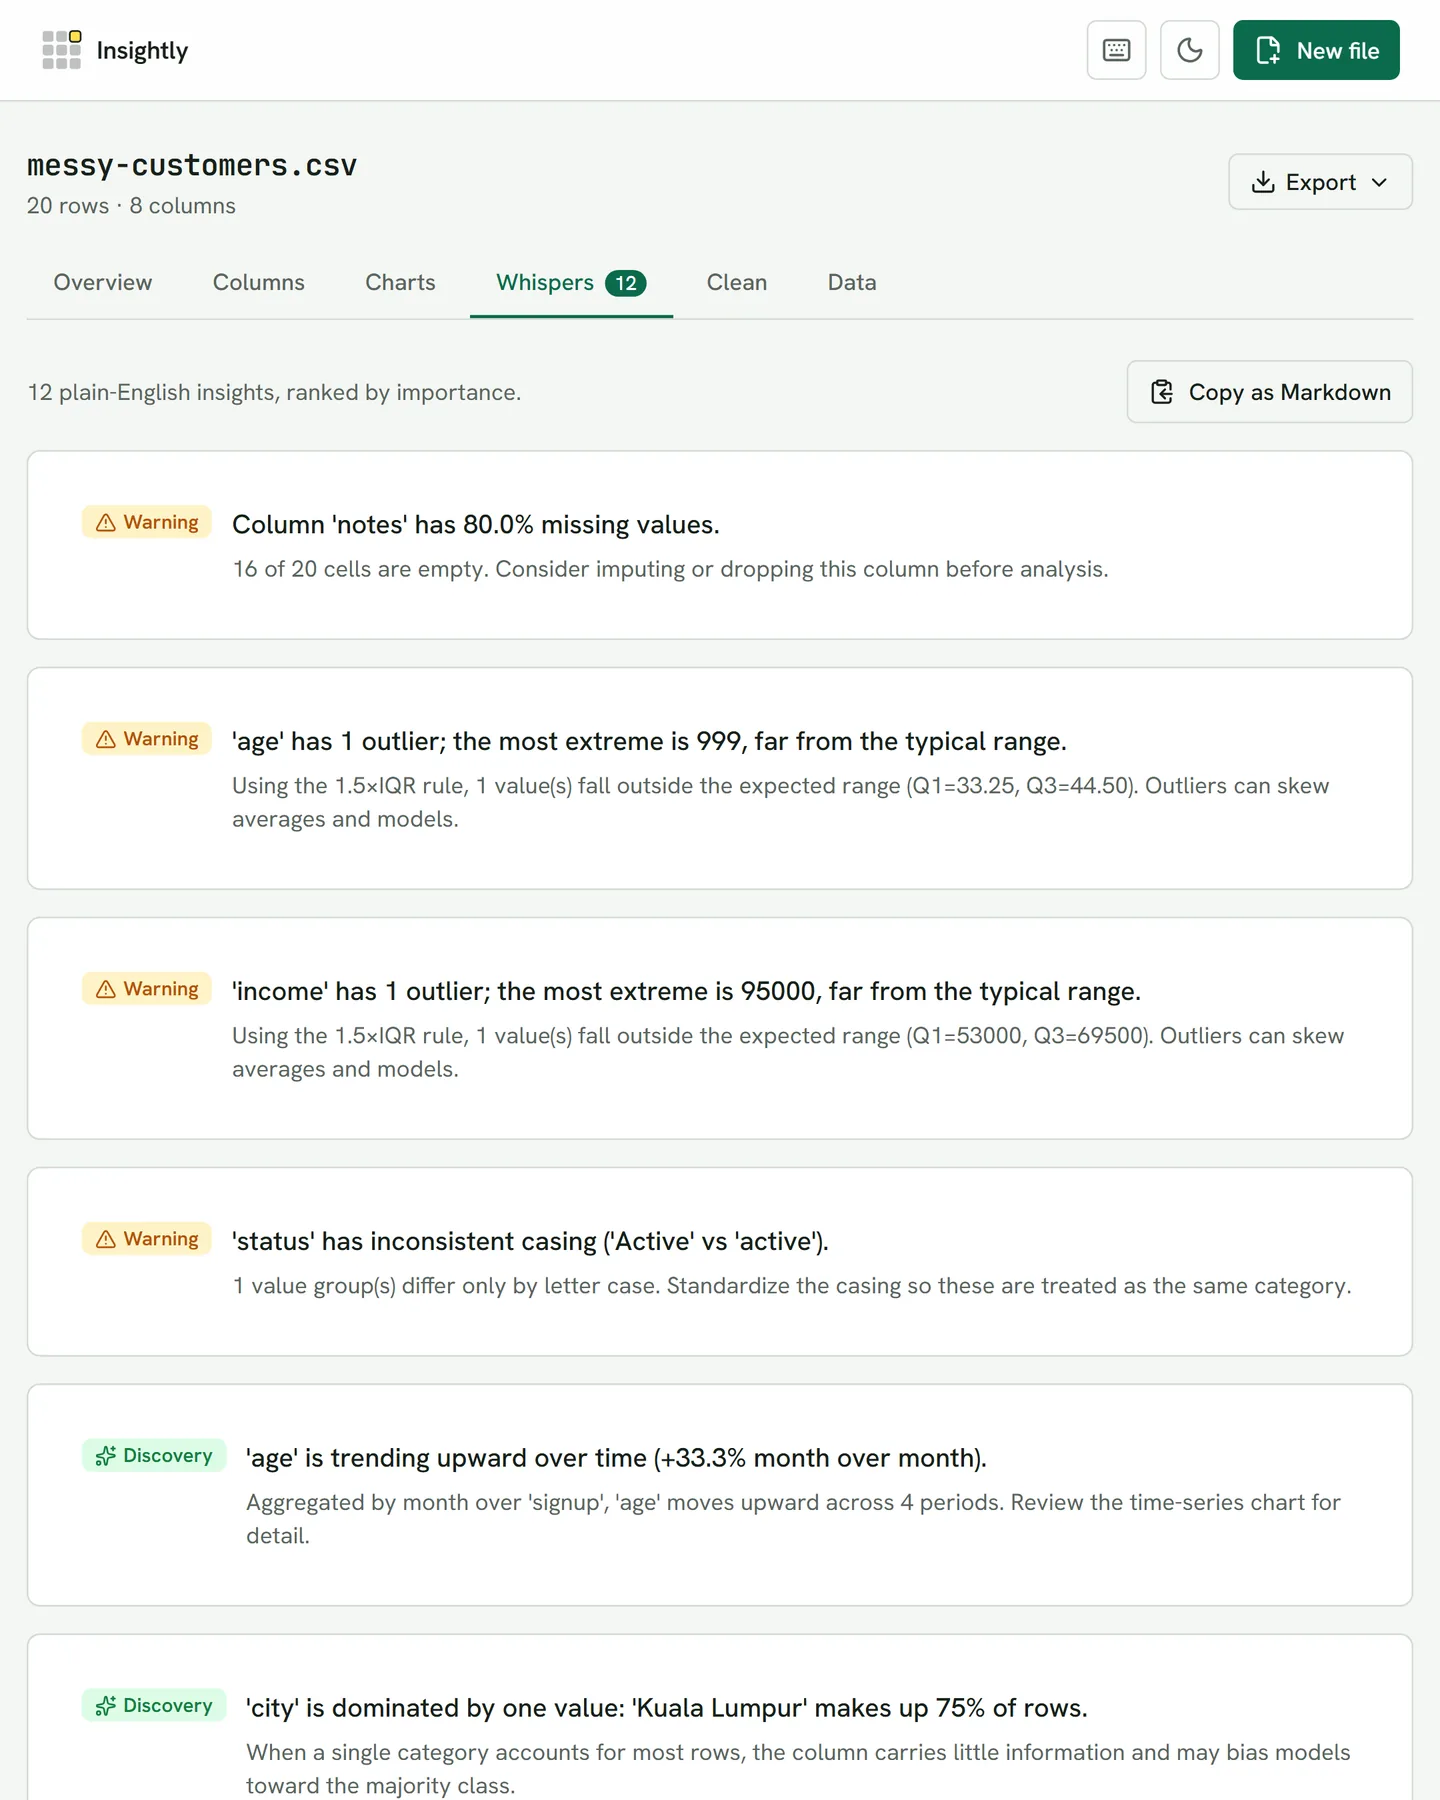
Whispers: 12 plain-English insights, ranked by importance. 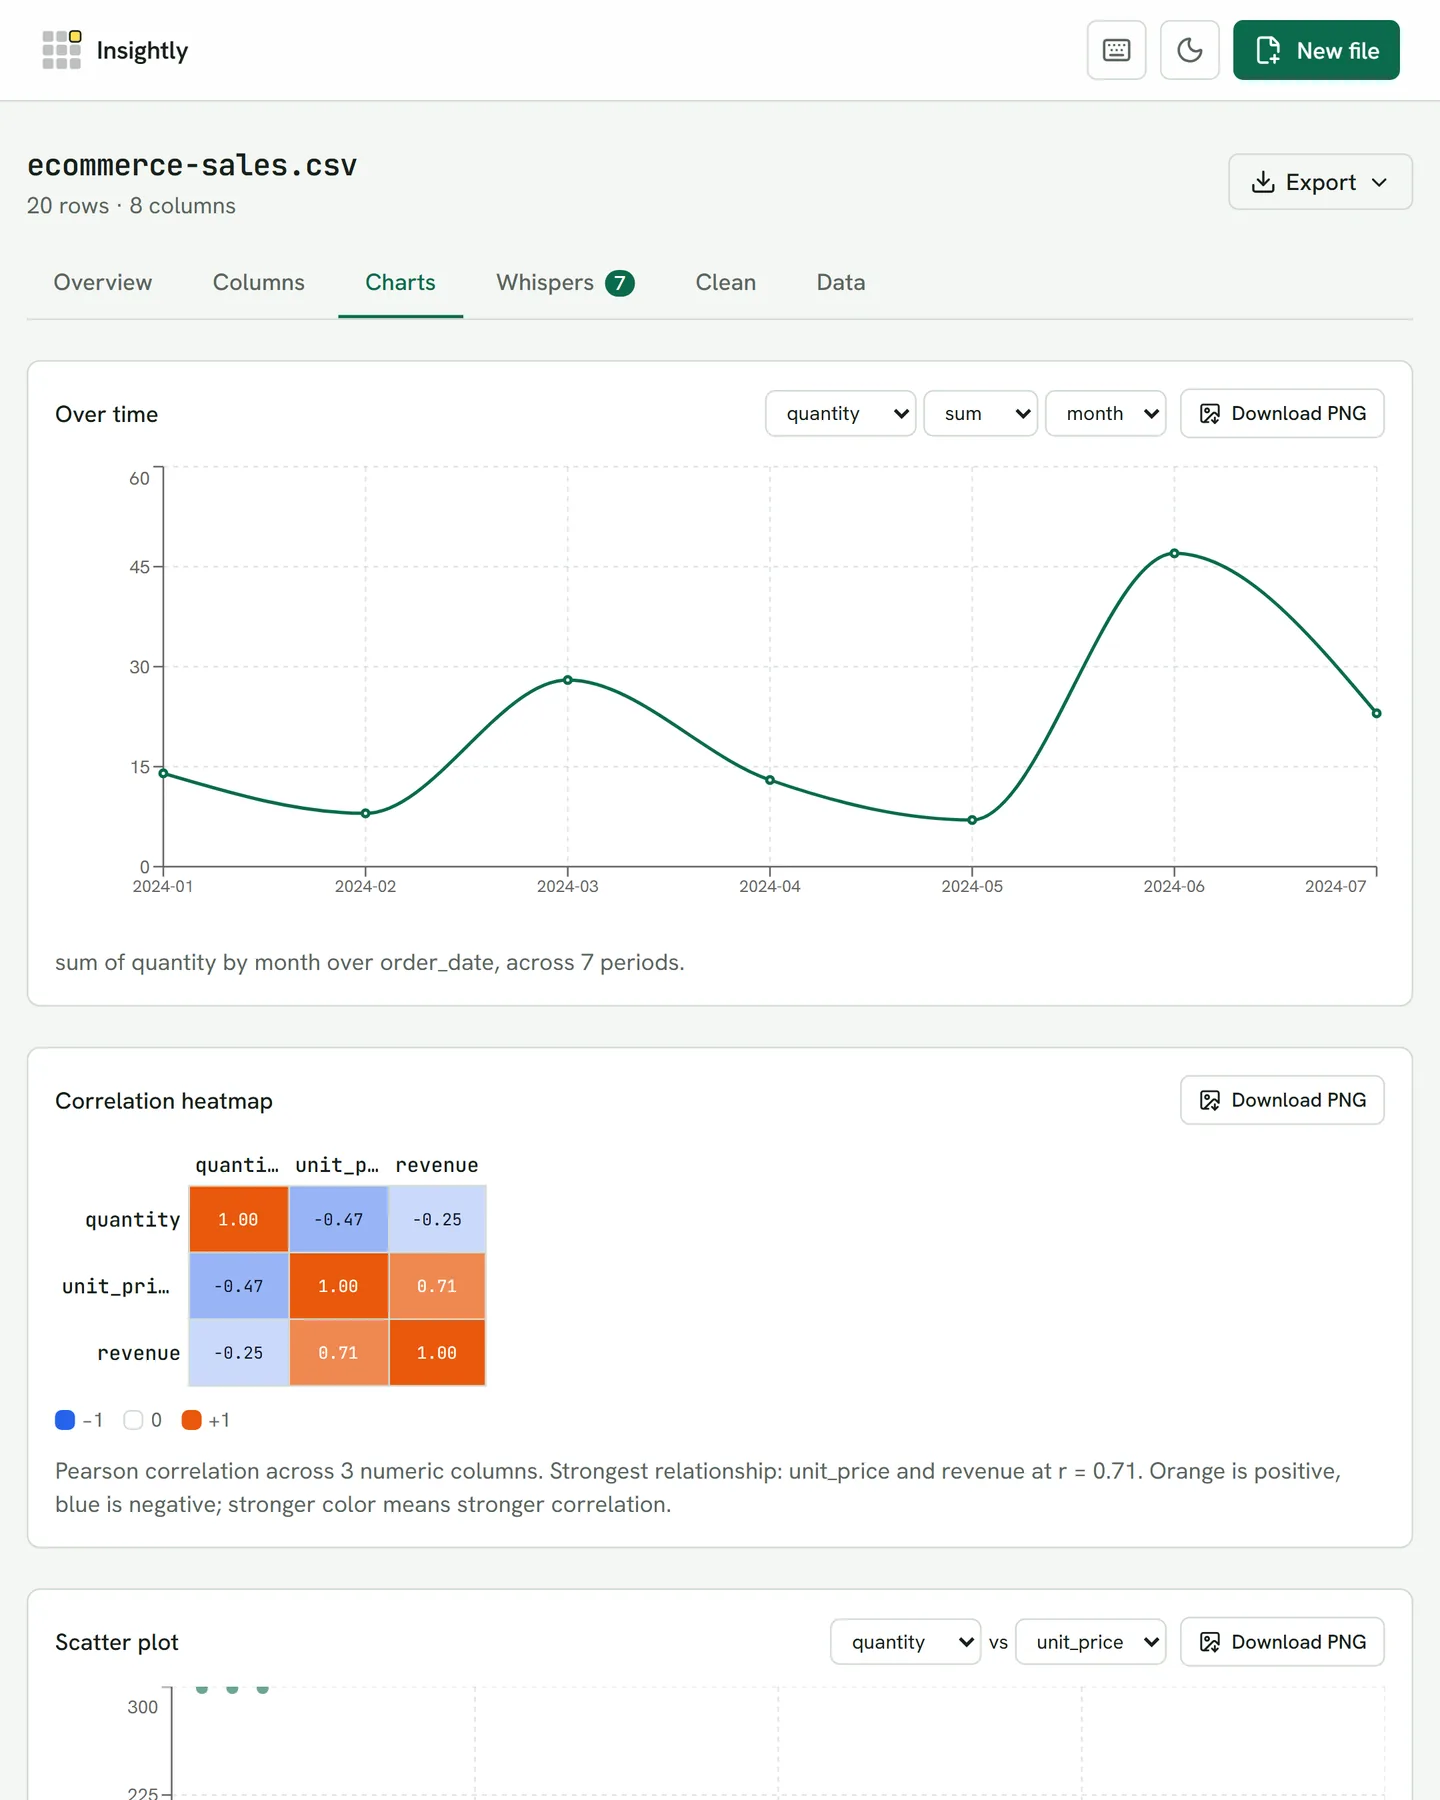
Charts: time series by month and a correlation heatmap. 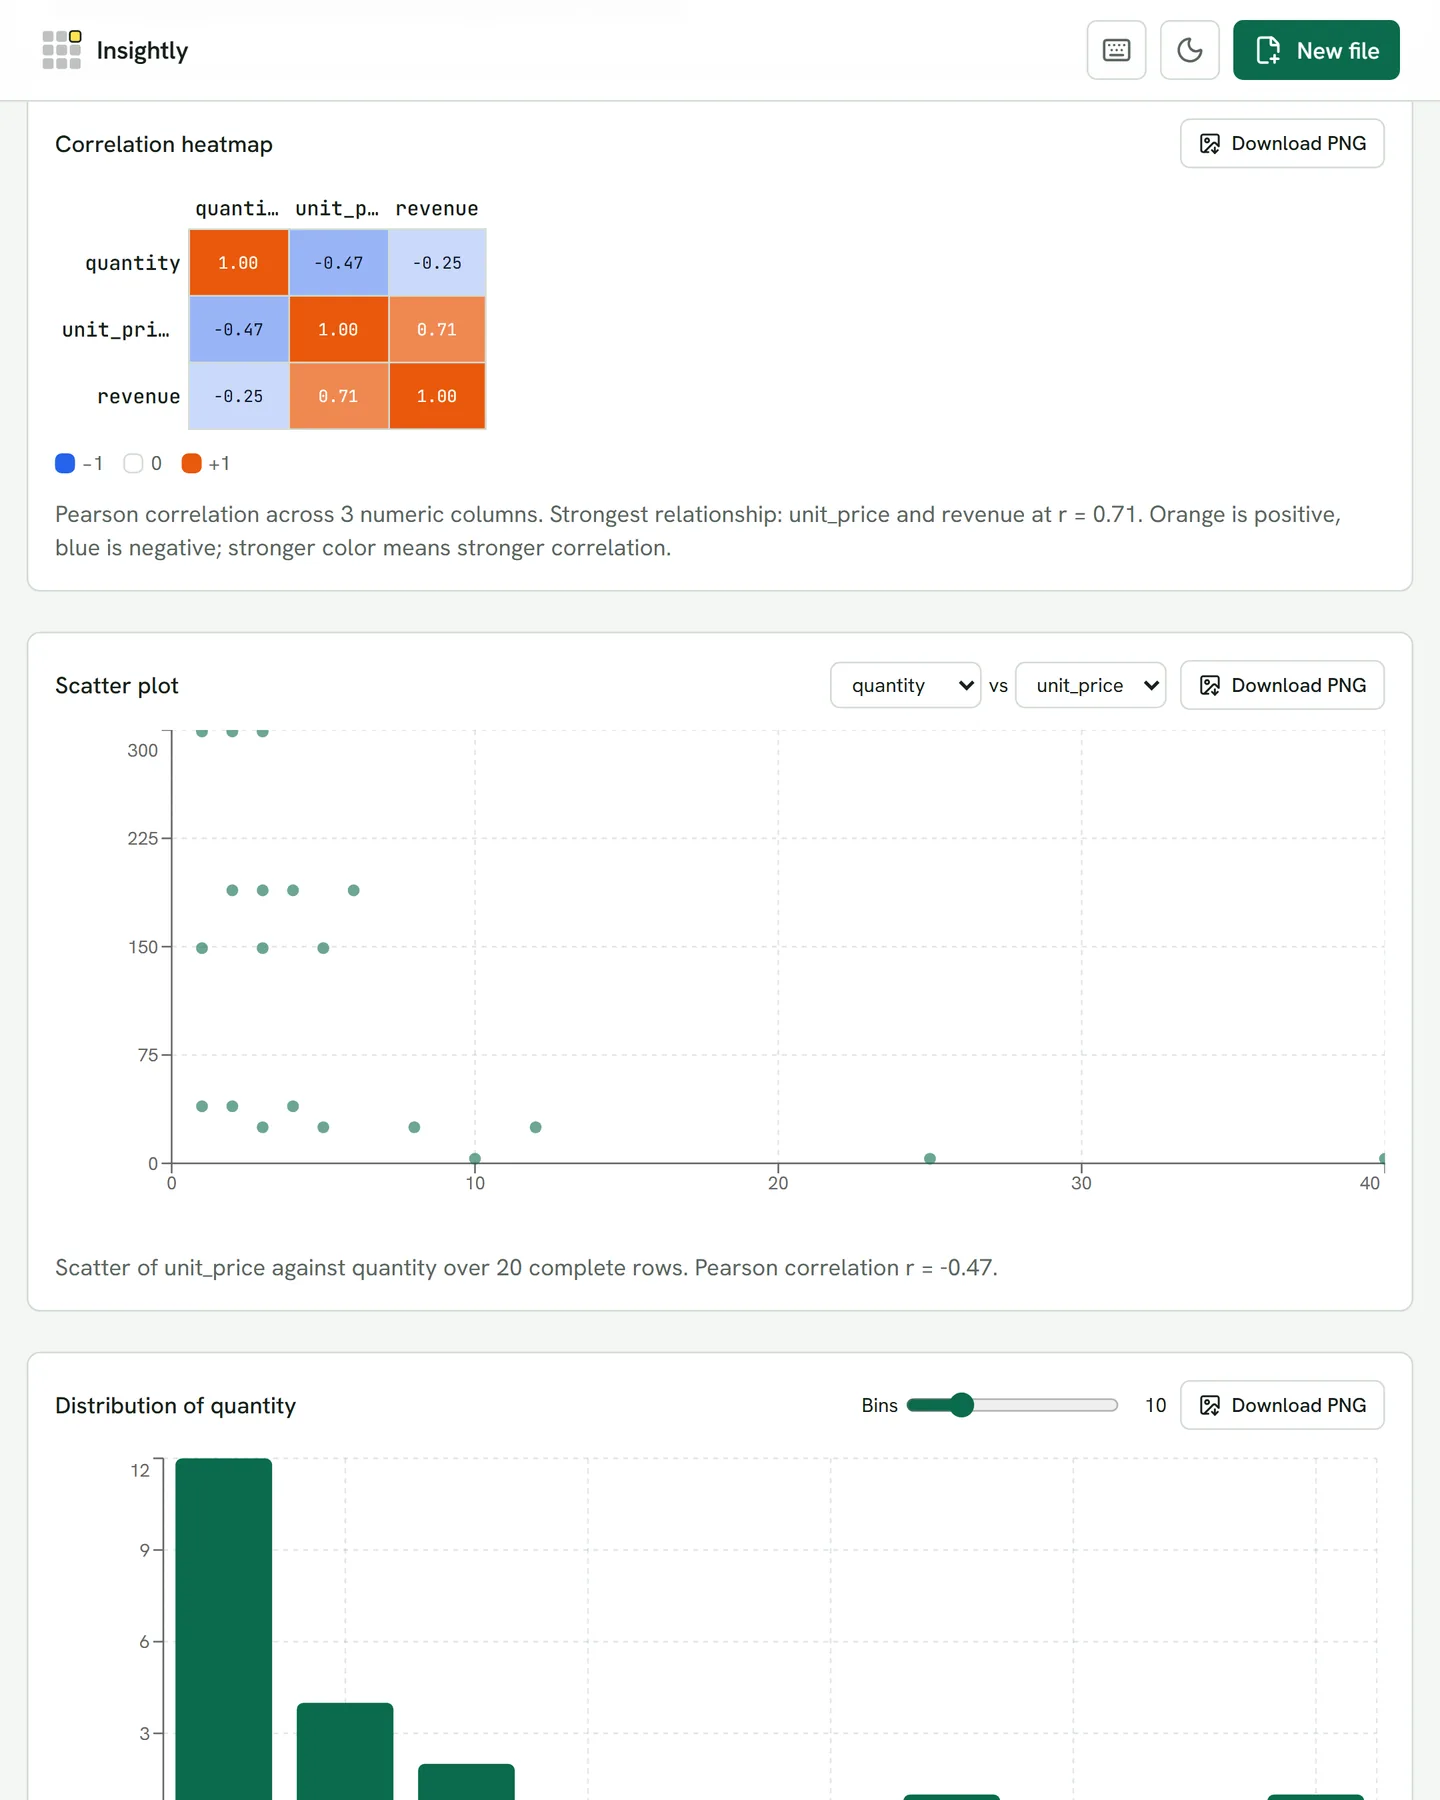
Correlation heatmap, scatter plot and distribution histogram. 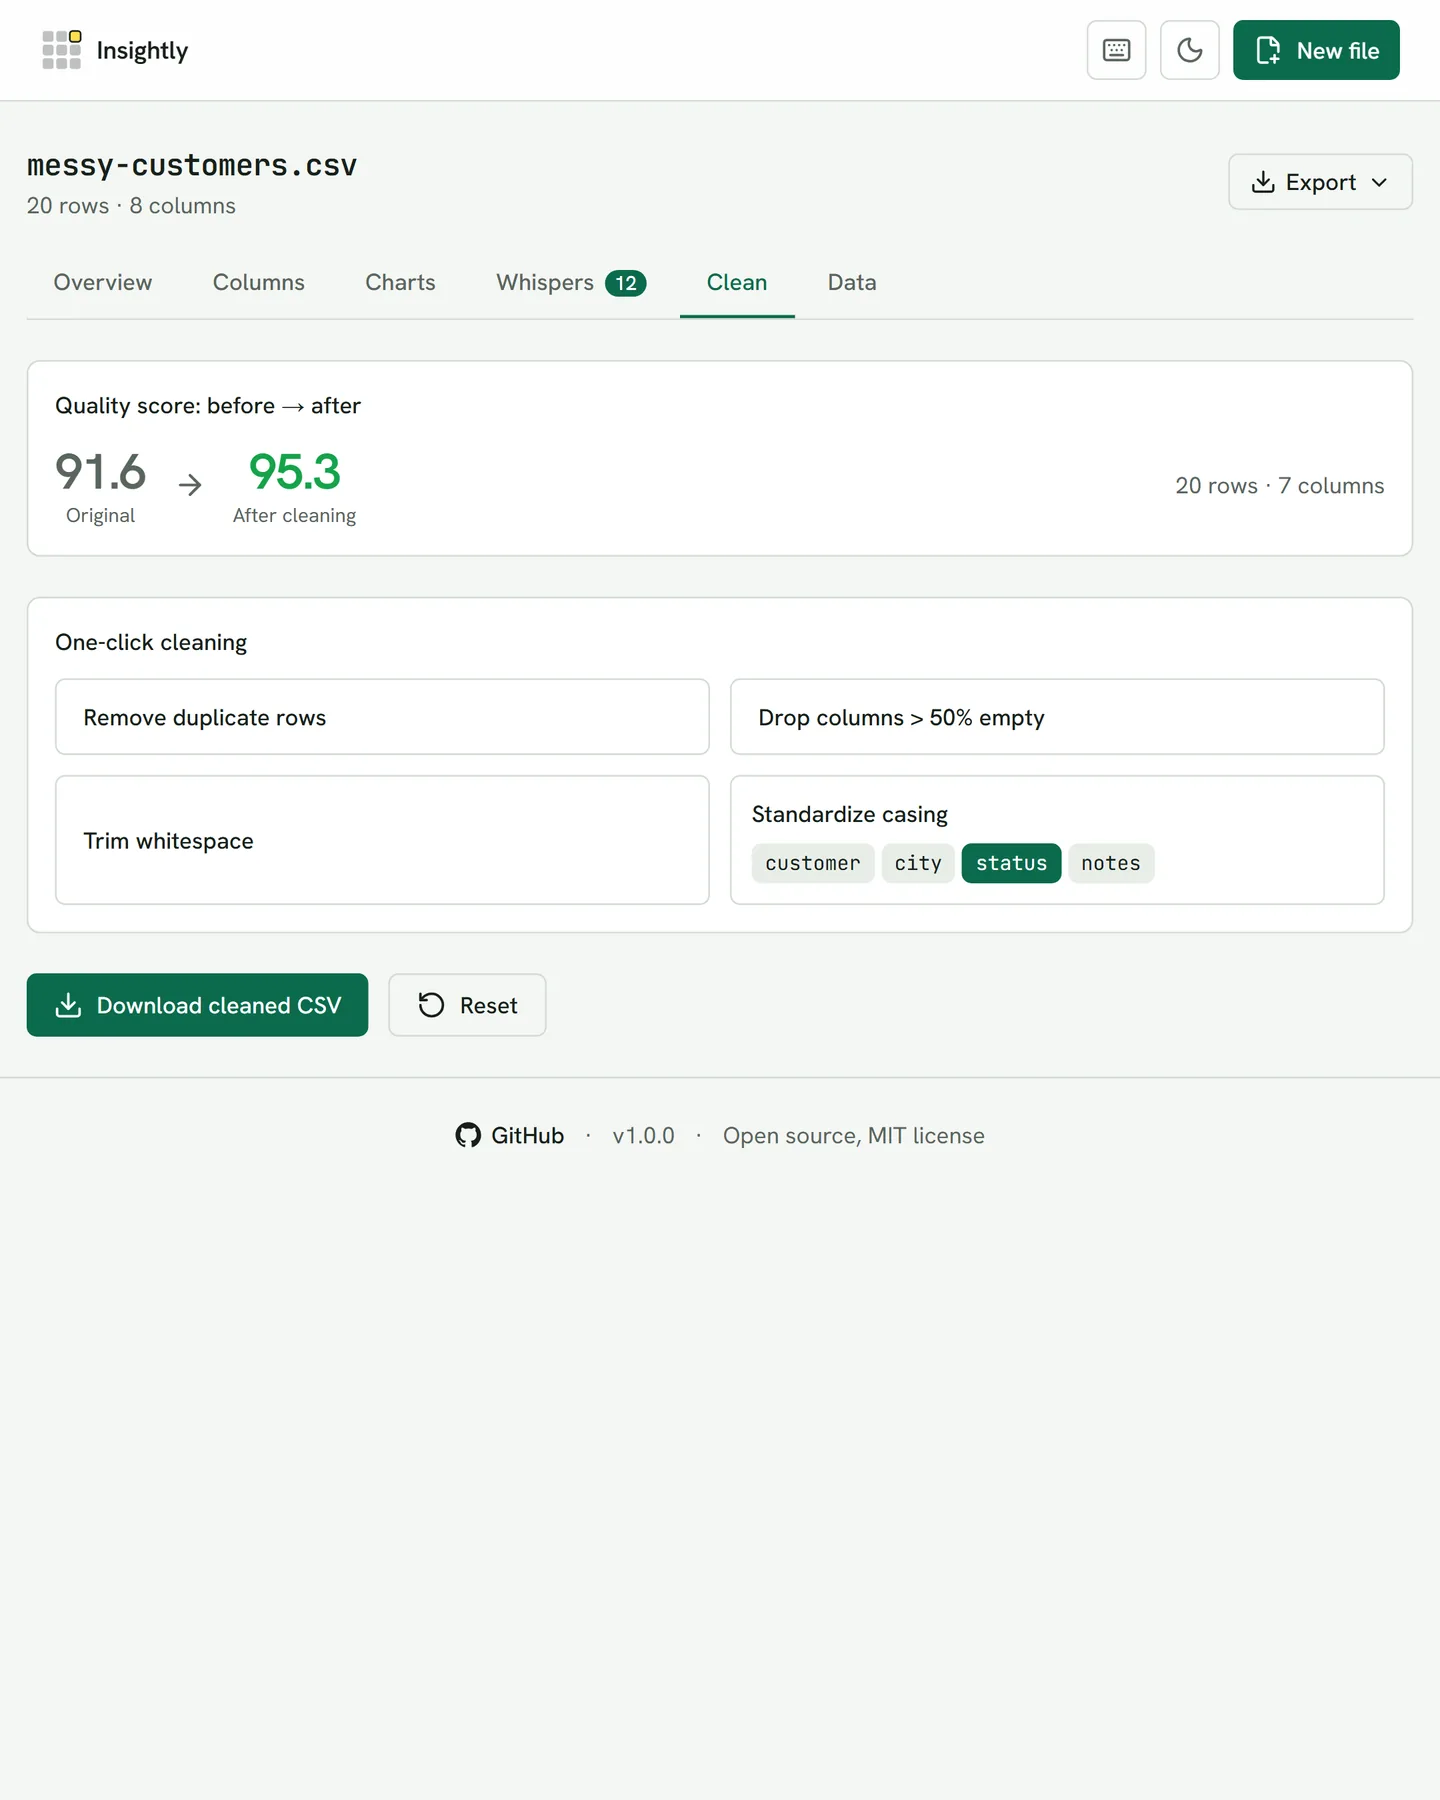
Clean: one-click fixes with a before and after score (91.6 to 95.3). 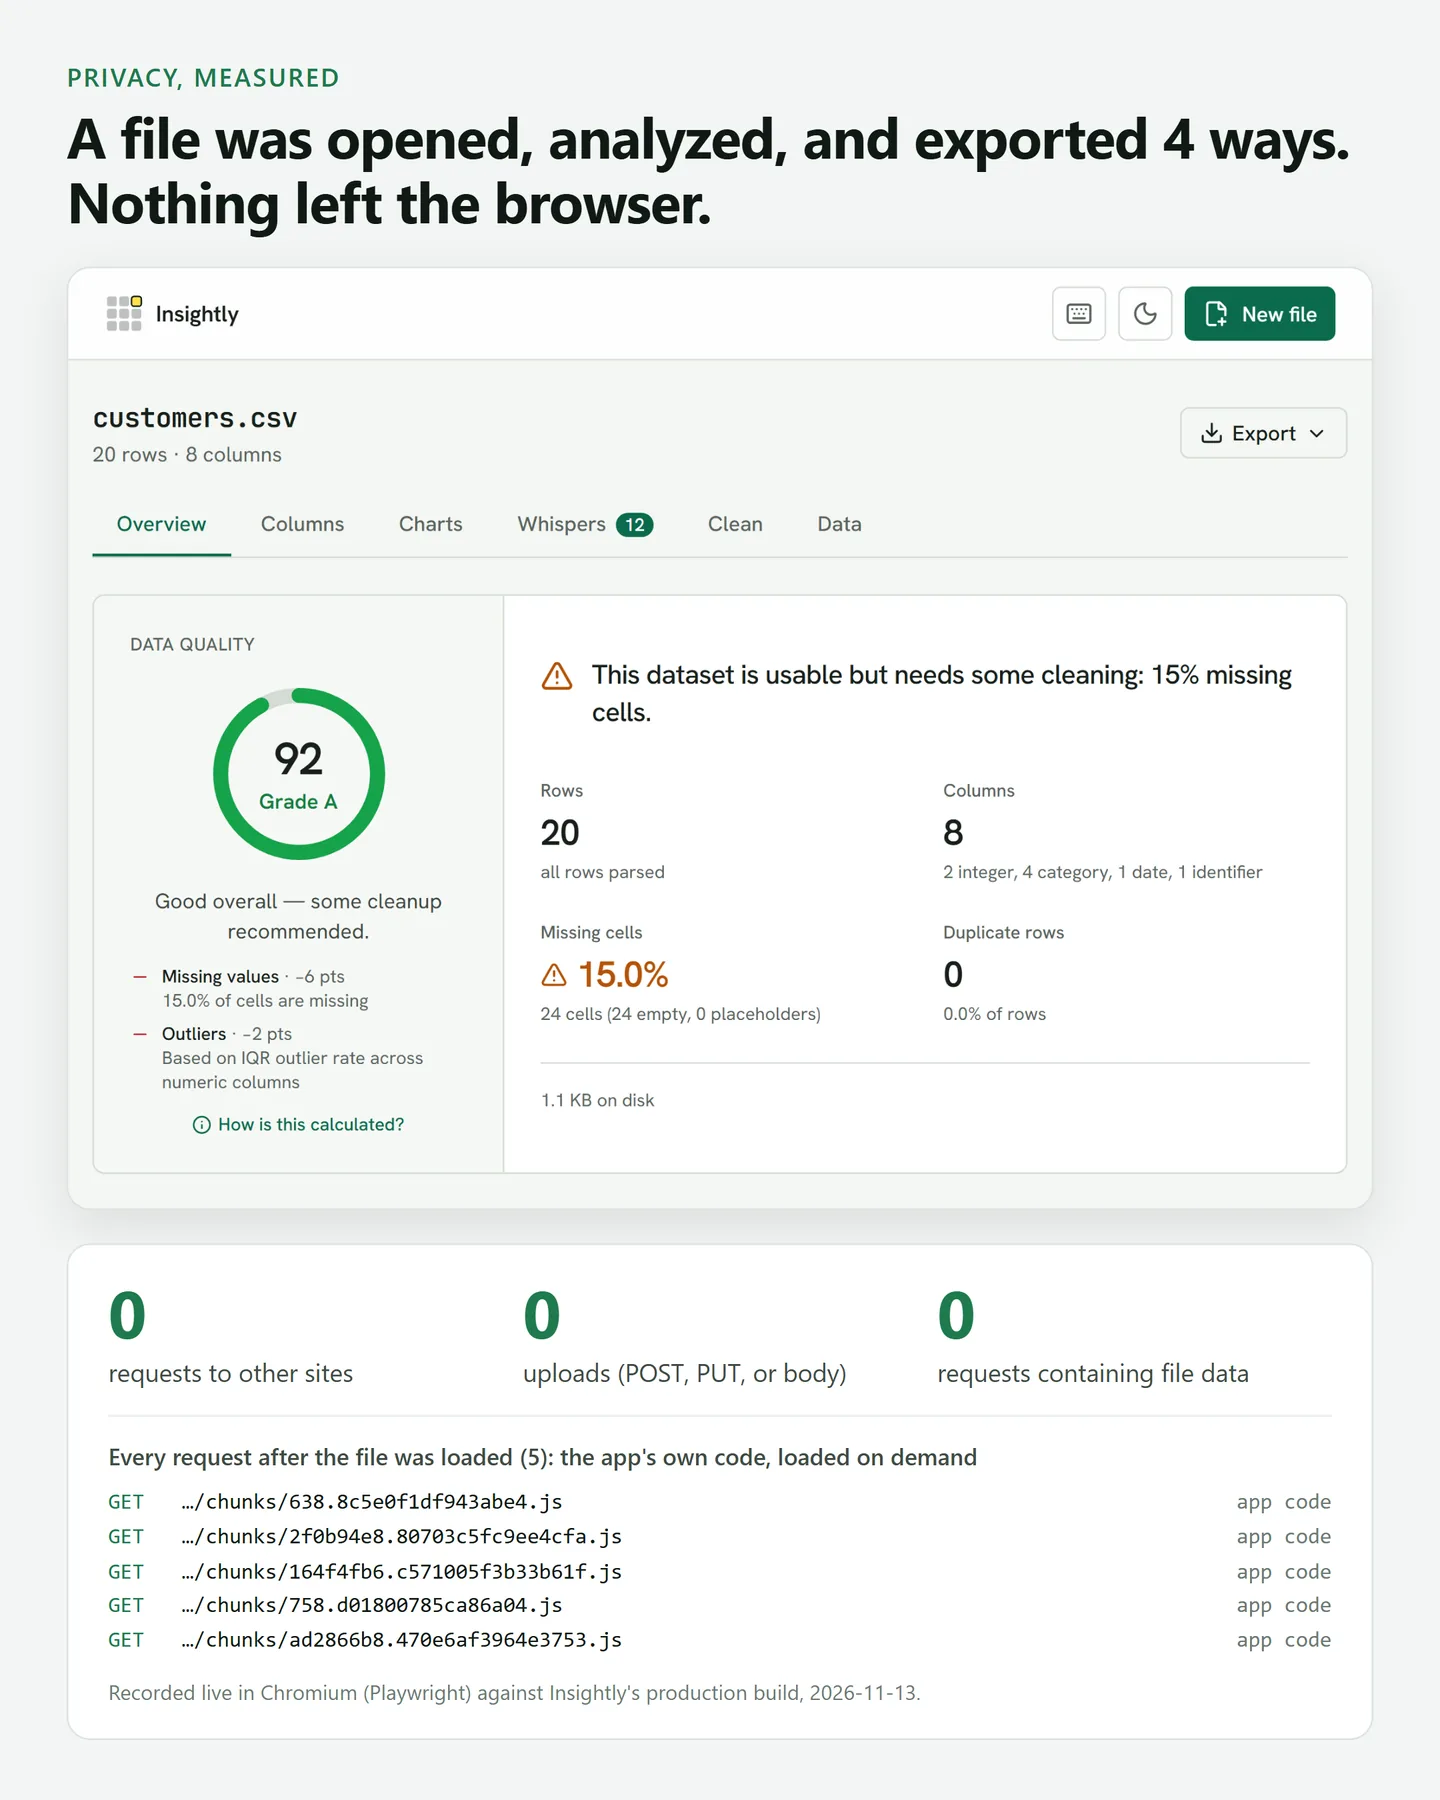
Privacy, measured: zero uploads or third-party requests, recorded with Playwright. 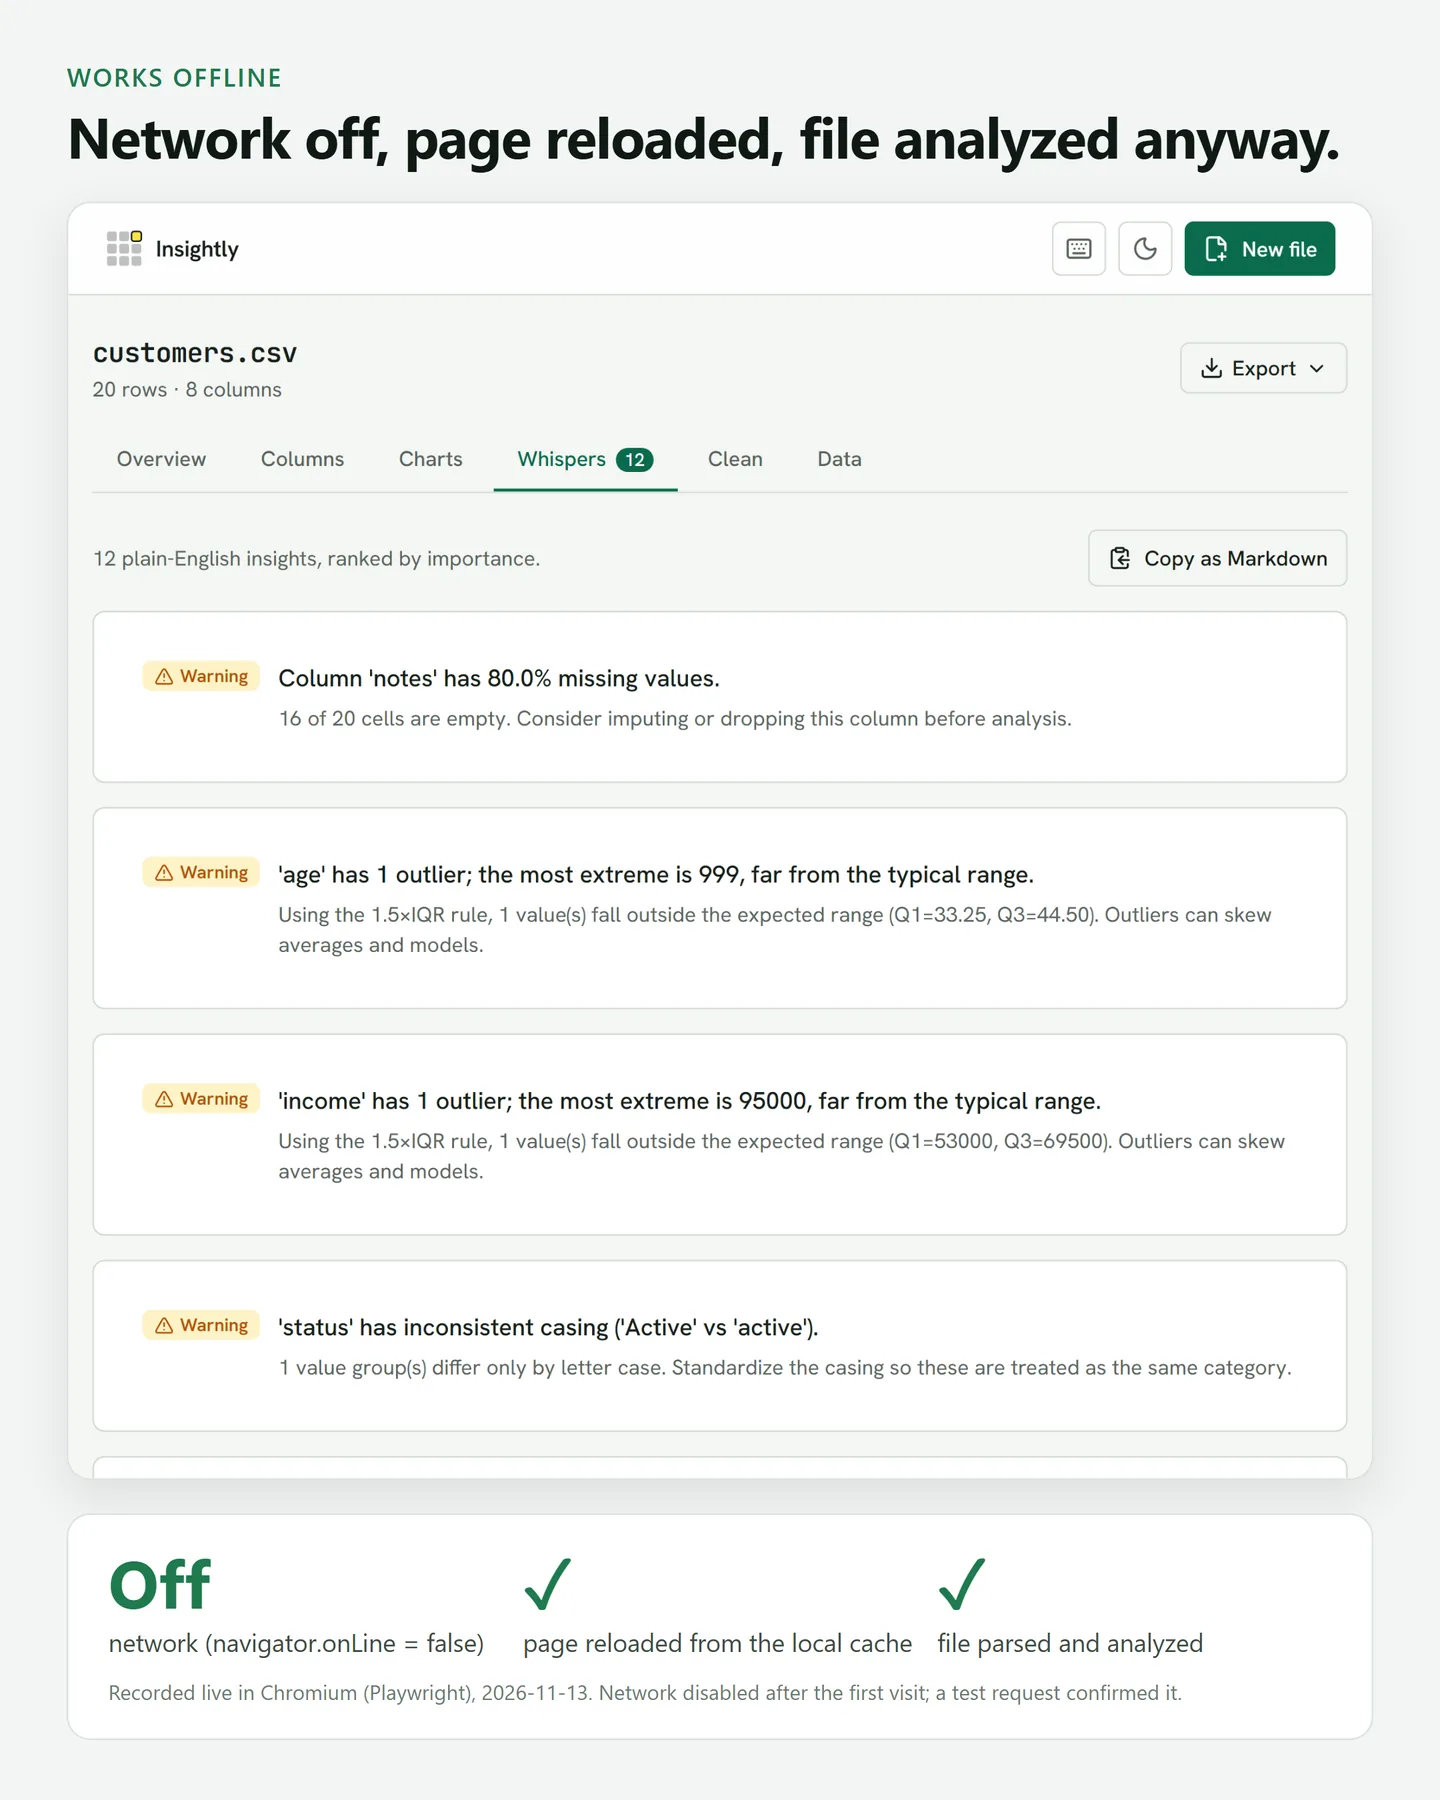
Works offline: network off, page reloaded, file analysed anyway.
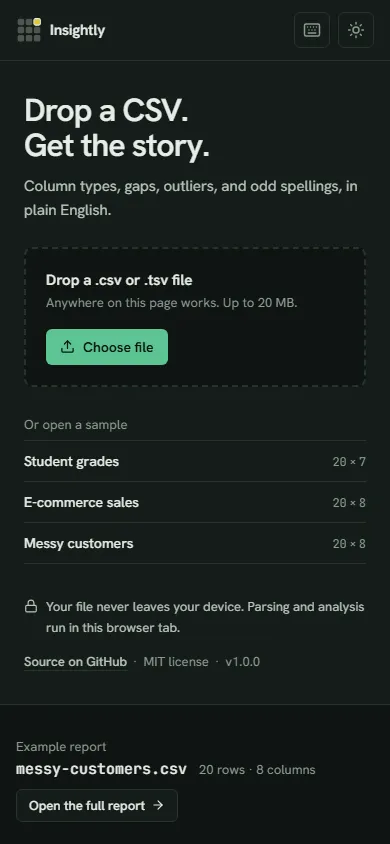
Mobile: drop a CSV or open a sample.
Technical decisions
Files never leave the browser
Parsing and analysis run in a Web Worker so the interface stays responsive. A Content-Security-Policy restricts network connections, and the README shows how anyone can verify the privacy claim in the browser's Network tab.
Tested like a product
226 unit and component tests, plus 8 Playwright end-to-end and accessibility tests, each run on desktop and a 375px mobile viewport. Strict TypeScript and GitHub Actions CI on every change.
Stack & credits
- Next.js 14 (static export)
- TypeScript
- Tailwind CSS
- Recharts
- Papaparse
- jsPDF
- Vitest
- Playwright